LIME - a model of a model
Local Interpretable Model-Agnostic Explanations (LIME) is an algorithm that explains a given prediction by approximating a separate interpretable model locally around the prediction[2]. To quote the lead author Marco Ribeiro:
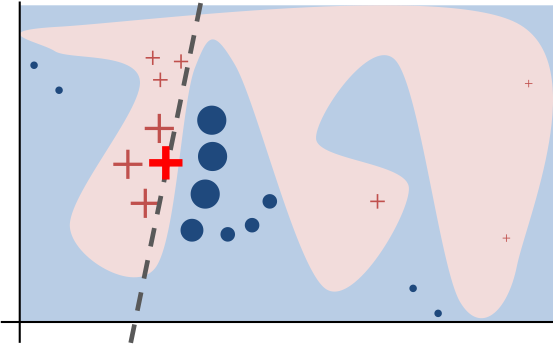
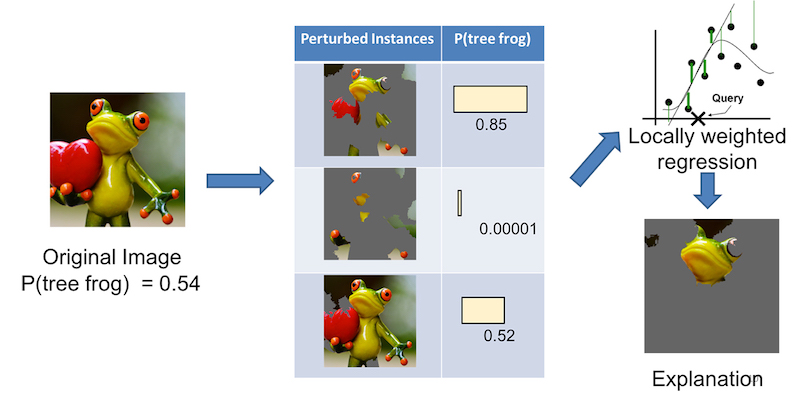
" Local refers to local fidelity - i.e., we want the explanation to really reflect the behaviour of the classifier 'around' the instance being predicted. This explanation is useless unless it is interpretable - that is, unless a human can make sense of it. Lime is able to explain any model without needing to 'peek' into it, so it is model-agnostic."This post won't delve into the mathematical details (they are in the published paper if you are interested). The picture at the top illustrates fitting a localized weighted linear model for a given prediction. For image classification, LIME would perturb the original image to generate a data set. For each perturbed sample, it calculates the probability that the image belongs to a given class according to the model. Then it learns a locally faithful linear model, giving weights to perturbed data points by their proximity to the original image (Fig.1.). It's important to stress that LIME generates a separate model that attempts to explain the prediction of the original model. The LIME model approximates a local linear model around the vicinity of the original sample being explained.
What did the model learn?
After importing the trained DenseNet model and test images, I used LIME to evaluate the model and generate a heat map image superimposed on the original image. The code is show below:
import lime
from lime import lime_image
from skimage.segmentation import mark_boundaries
import skimage
from keras.preprocessing.image import ImageDataGenerator,array_to_img, img_to_array, load_img, array_to_img
from keras.applications.densenet import preprocess_input

explainer = lime_image.LimeImageExplainer()

###num_samples – size of the neighborhood (perturbed instances) to learn an interpretable model
explanation = explainer.explain_instance(test_preprocessed[2], model.predict, labels=['benign','melanoma','sk'], top_labels=3, hide_color=0, num_samples=200)
temp, mask = explanation.get_image_and_mask(0, positive_only=False, num_features=10, hide_rest=False)
plt.imshow(mark_boundaries(array_to_img(temp), mask))
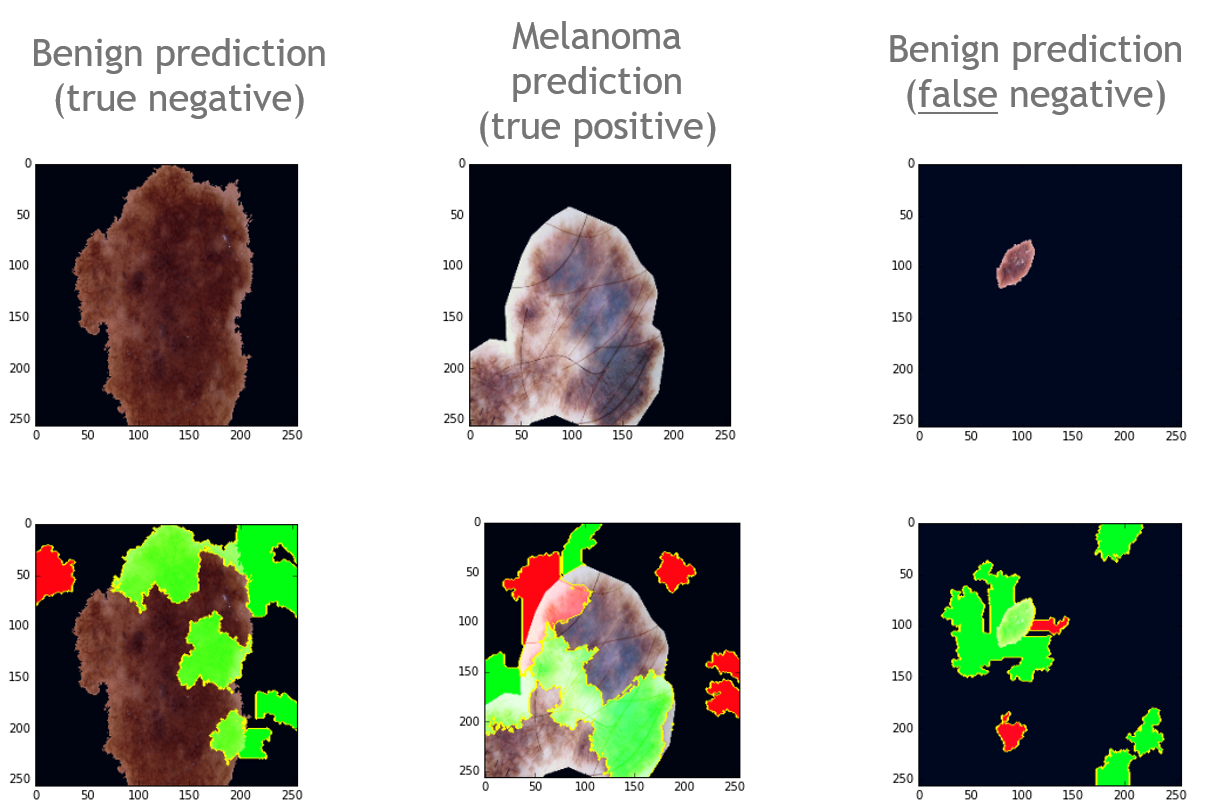
The image output from the codes are shown in Fig.2. The green pixels represent features that are for the prediction of that class, and red pixels means they are against the prediction. After looking through some misclassified samples, I noticed that they are similar to the right side image in Fig.2.(false negative) - they consist of smaller lesions relative to the rest. This suggests that the model struggled to learn relevant features such as edges and uneven colorations (perhaps due to the resolution of such small region of interest). It also seems to think that the black background pixel is somehow associated with a benign prediction.
Potential ways to improve
One way to help the DenseNet model learn better is by training on more images of small melanoma lesions (distribution of data matters), and trying different augmentation techniques for preprocessing. LIME has provided interesting insights into the flaws of the melanoma classifier, allowing the user to evaluate and improve 'black box' model with an intuitive understanding. Besides image prediction, LIME also works with text or categorical data for explaining classifier models (but not regression). And it's also available in R . Check out the video below if you are interested in learning more.
REFERENCES
[1]Wu, P., GDPR and its impacts on machine learning applications , Medium.com (https://medium.com/trustableai/gdpr-and-its-impacts-on-machine-learning-applications-d5b5b0c3a815)
[2]Ribeiro et al. Why should I trust you? Explaining the predictions of any classifier, https://arxiv.org/pdf/1602.04938.pdf